This scheme retains and recalculates means-tested benefits and sets the working age adult Citizen’s Income at £54.20 per week. The article evaluates changes to the number of claims for means-tested benefits and to the amounts of means-tested benefits claimed.
Introduction
This research note builds on a EUROMOD[note]This article uses EUROMOD version G2.0++. The contribution of all past and current members of the EUROMOD consortium is gratefully acknowledged. The process of extending and updating EUROMOD is financially supported by the Directorate General for Employment, Social Affairs and Inclusion of the European Commission [Progress grant no. VS/2011/0445.] The UK Family Resources Survey data was made available by the Department of Work and Pensions via the UK Data Archive. All remaining errors and interpretations are the author’s responsibility.[/note] working paper published in April 2015: Two Feasible Ways to Implement a Citizen’s Income, [note]Malcolm Torry, Two Feasible Ways to Implement a Citizen’s Income, Institute to Social and Economic Research Working Paper EM6/15, Colchester: Institute for Social and Economic Research, University of Essex, April 2015,[/note] which showed that a strictly revenue neutral scheme (i.e., a scheme that could be paid for by adjusting Income Tax and National Insurance Contributes rates and thresholds and means-tested and other benefits) with a working age adult Citizen’s Income set at £50 per week could be paid for by raising Income Tax rates by 3%, by abolishing Income Tax Personal Allowances, and by making adjustments to National Insurance Contributions[note]£54.20 pw is the value of the working age adult’s Citizen’s Income as it would have been in 2013. The most recent tax and benefits regulations available in EUROMOD version G2.0++ are those for 2013/14, and the most recent Family Resource Survey data is for 2009, uprated to 2013 values. It is therefore not currently possible to simulate Citizen’s Income schemes for more recent periods. ‘The factors that are used to update monetary variables (parameter sheet Uprate_uk) from the mid-point of the data year (October 2009) to the mid-point of the policy years applying on June 30th (i.e. October 2010 to October 2013) are shown in Annex 1 of the EUROMOD UK country report. No other updating adjustments are employed. Thus the distribution of characteristics (such as employment status and demographic variables) as wellatk as the distribution of each income source that is not simulated remain as they were in 2009/10’ (Paola De Agostini and Holly Sutherland, Euromod Country Report: United Kingdom 2009-2013, Colchester: Institute for Social and Economic Research, Essex University, 2014)[/note]. An important difference between this scheme and previous illustrative schemes is that it retained in-work and out-of-work means-tested benefits and recalculated them for each household by taking into account each household’s Citizen’s Incomes in the same way as other income. Microsimulation of the scheme showed that it would impose almost no household [note]In the working paper, I studied the gains and losses experienced by households, and not those experienced by individuals. I take the same approach here. There are good arguments for both approaches. It is individuals who receive income, so gain or loss is an individual experience; and within households income is not necessarily equitably shared, so the amounts that individuals receive might be more relevant than the amount that the household receives. However, we can assume that in most cases income is pooled within households, at least to some extent, so if one member gains and another loses then the household might be better off, and that might be a more significant fact than that one member of the household has suffered a loss in disposable income. Another point to make about households is that they are of different sizes, so the absolute gain or loss is not particularly relevant. However, percentage gains and losses are relevant, so this is the measure that we shall use. Particularly problematic is knowing how to order households. A household of two parents and three children with twice the disposable income of a household containing just one adult will not be as well off as that individual adult. For the purposes of the working paper I ignored the different sizes of households, and I follow the same approach here. More detailed research, employing household weights so that the disposable incomes of households of different sizes could be more relevantly compared, would constitute a further research project. See Malcolm Torry, Research note: A feasible way to implement a Citizen’s Income, Institute to Social and Economic Research Working Paper EM17/14, Colchester: Institute for Social and Economic Research, University of Essex, September 2014,, pp. 3-4)[/note] disposable income losses on low income households at the point of implementation, and manageable losses on households in general.
A £54.20 Citizen’s Income for working age adults
I have received the perfectly correct suggestion that £50 per week is below the value of the removed Income Tax Personal Allowance and National Insurance Contributions Primary Threshold. A more natural level for the working age Citizen’s Income would replicate that value, suggesting that in the context of the 2013 tax and benefits system it would have been set at £54.20 per week. [note]The calculation is as follows: Income Tax Personal Tax Allowance in 2013/14 was £9,440. Removing the allowance would mean additional Income Tax of 9,440 x 0.2 = £1,888 being paid. The Primary Earnings Threshold for National Insurance Contributions was £149 per week. Reducing the threshold to zero would mean additional National Insurance Contributions of 149 x 52 x 0.12 = £930. The total additional payment would be 2,888 + 930 = 2,818, which translates as £54.20 per week: so this is the level of Citizen’s Income required to compensate for the loss of the Income Tax Personal Allowance and the reduction of the Primary Earnings Threshold to zero.[/note]
I have therefore evaluated this new scheme and found that it would be almost strictly revenue neutral if Income Tax rates were raised by 3.5%, which is only 0.5% above the rise required for the £50 per week scheme.
As with the scheme in the working paper, the scheme raises National Insurance Contributions (NICs) above the Upper Earnings Threshold from 2% to 12% and the Primary Threshold is reduced to zero. This has the effect of making NICs payable on all earned income at 12%. This seems to me to be an entirely legitimate change to make. The ethos of a flat rate benefit such as Citizen’s Income is consistent with both progressive tax systems and with flat rate tax systems, but not with regressive tax systems.[note]A.B. Atkinson, Public Economics in Action: The Basic Income / Flat Tax Proposal, Clarendon Press, Oxford, 1995[/note] The Income Tax Personal Allowances are set at zero, and a conservative estimate is made of administrative savings. [note]In 2013/14 Council Tax Benefit was centrally regulated. Under the Government’s localisation agenda, its replacement, Council Tax Support, is locally regulated as well as locally administered. This means that every borough in the country can invent its own regulations, and, in particular, its own taper rate. It will be far from easy to include Council Tax Support in future tax and benefits simulations.[/note]
Table 1 summarises the results obtained from microsimulation of the £50 per week scheme tested in the working paper, and of the £54.20 scheme proposed here.
Table 1: Citizen’s Income levels for Citizen’s Income scheme based on working age adult Citizen’s Incomes of £50 and £54.20 per week, the increased Income Tax rates required to fund them, and the extent of losses at the point of implementation. [note]The method is as follows: A new set of benefits is created in the UK country system in EUROMOD: a Citizen’s Pension (CP) for over 65 year olds, a Citizen’s Income (CI) for adults aged between 25 and 64, a young person’s Citizen’s Income (CIY) for adults aged between 16 and 24), and a Child Citizen’s Income (CIC) for children aged between 0 and 15. In the definitions of constants, levels are set for these Citizen’s Incomes, and all Personal Tax Allowances are set at zero. So that the additional taxable income is taxed at the basic rate, and not at the higher rate, the first tax threshold is changed from 32010 to 42010. The National Insurance Contribution Primary Threshold is set to zero, and the NIC rate above the Upper Earnings Limit is set to 12% (to match the rate below the limit). The Citizen’s Income total is added to non-means-tested benefits and also to the means applied to means-tested benefits. Simulations of the 2013 system and the system being tested generate two lists of household disposable incomes for the entire Family Resource Survey sample. These then generate a list of gains (negative gains are losses), and the total of the gains gives the net cost of the scheme for the sample. To convert EUROMOD’s monthly figures to annual figures, and the sample size to the total population, a multiplier of (12 x 64.1m / 57,381) = 13.4 gives the cost for the UK population. A process of trial and error adjusts the Income Tax rates until the net cost minus the assumed administrative saving is below £2bn per annum. The initial disposable incomes are then ordered, the bottom 10% are selected, and the percentage gains are evaluated. The process is then repeated for all households. The data is then ordered in different ways to obtain the other statistics required.[/note]
[table id=2 /]
The new scheme imposes fewer losses on households in the lowest earnings decile, and overall fewer losses over 5%. (Only 0.11% of households suffer losses over 15%, and then only marginally so).
Given that the working age adult Citizen’s Income is higher, and that the pattern of losses is preferable to the £50 per week scheme, it is the £54.20 scheme that I shall evaluate further here, and in particular I shall evaluate it in relation to a question that I have been asked about such a Citizen’s Income scheme’s effect on the numbers and amounts of claims for means-tested benefits – for one of the claimed advantages of a Citizen’s Income scheme is that it would reduce reliance on means-tested benefits.
Changes to claims for means-tested benefits brought about by a Citizen’s Income scheme based on a working age adult Citizen’s Income (for all those aged 25 to 64) set at £54.20 per week in 2013
Table 2 gives the results:[note]The method is as follows: A new set of benefits is created in the UK country system in EUROMOD: a Citizen’s Pension (CP) for over 65 year olds, a Citizen’s Income (CI) for adults aged between 25 and 64, a young person’s Citizen’s Income (CIY) for adults aged between 16 and 24), and a Child Citizen’s Income (CIC) for children aged between 0 and 15. In the definitions of constants, levels are set for these Citizen’s Incomes, and all Personal Tax Allowances are set at zero. So that the additional taxable income is taxed at the basic rate, and not at the higher rate, the first tax threshold is changed from 32010 to 42010. The National Insurance Contribution Primary Threshold is set to zero, and the NIC rate above the Upper Earnings Limit is set to 12% (to match the rate below the limit). The Citizen’s Income total is added to non-means-tested benefits and also to the means applied to means-tested benefits. Simulations of the 2013 system and the system being tested generate two lists of household disposable incomes for the entire Family Resource Survey sample. These then generate a list of gains (negative gains are losses), and the total of the gains gives the net cost of the scheme for the sample. To convert EUROMOD’s monthly figures to annual figures, and the sample size to the total population, a multiplier of (12 x 64.1m / 57,381) = 13.4 gives the cost for the UK population. A process of trial and error adjusts the Income Tax rates until the net cost minus the assumed administrative saving is below £2bn per annum. The initial disposable incomes are then ordered, the bottom 10% are selected, and the percentage gains are evaluated. The process is then repeated for all households. The data is then ordered in different ways to obtain the other statistics required.[/note]
Table 2: Reductions in the numbers of claims for in-work and out-of-work means-tested benefits and reductions in the number of claimant households claiming more than £30 per week.
[table id=3 /]
The number of Housing Benefit claims fell by only 3.57%, but the average reduction in the value of claims was £27.91 (8.79%). Again, no claims increased in value.
Redistribution
Figure 1 shows the aggregate redistribution that would occur if the Citizen’s Income scheme based on a working age adult Citizen’s Income of £54.20 were to be implemented.
Figure 1
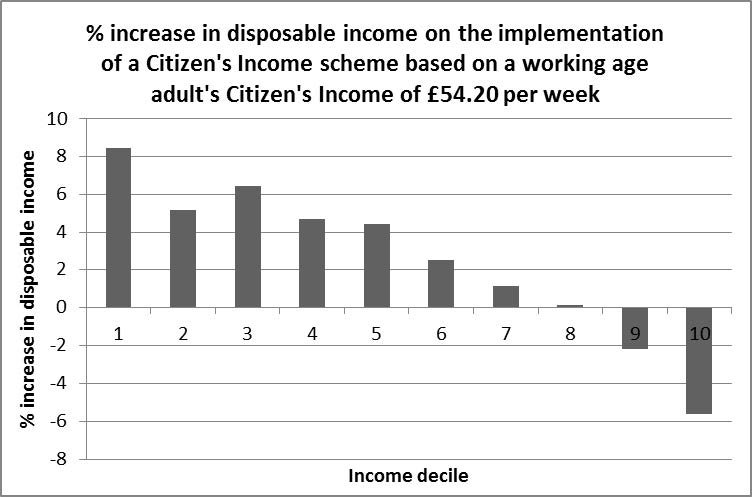
Figure 2 compares this redistribution pattern with the redistribution pattern that would occur with the previously researched scheme based on a working age adult Citizen’s Income of £50 per week:
Figure 2
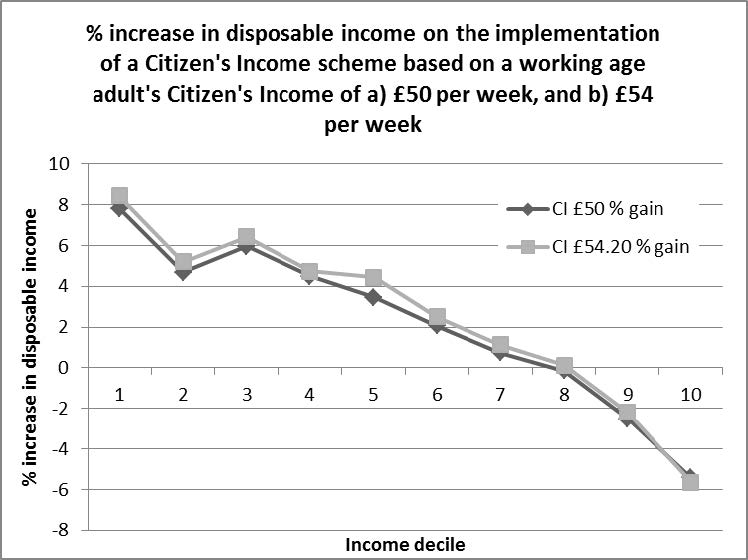
As we can see, the scheme based on the larger working age adult Citizen’s Income generates marginally higher redistribution.
Discussion
Because the only changes required in order to implement the scheme described in this research note would be
- payment of the Citizen’s Incomes (calculated purely in relation to the age of each individual)
- changes to Income Tax and National Insurance Contribution rates and thresholds
- easy to achieve recalculations in existing means-tested benefits claims
this scheme could be implemented very quickly.
A strictly revenue neutral scheme with a working age adult Citizen’s Income set at £54.20 per week in 2013 would have imposed very few losses at the point of implementation, would have redistributed somewhat from rich to poor, would have increased Income Tax rates by only 3.5%, and would have reduced substantially both the numbers of claims for in-work and out-of-work means-tested benefits and the amounts of those benefits paid to households. With a Citizen’s Income scheme of this type, a significant number of households would no longer be receiving Tax Credits, and an equally significant number of households would no longer be claiming over £30 per week. There would be a precipitous fall in the number of claims for out-of-work means-tested benefits, and almost no households would be claiming over £30 per week.
The impact of this quite conservative and easy to achieve Citizen’s Income scheme on both employment incentives and poverty would be both positive and considerable.