Introduction
In the second issue of the Citizen’s Income Newsletter in 2010 we published a research note which employed a Department for Work and Pensions spreadsheet to calculate the effects of establishing a universal and nonwithdrawable benefit on three types of household containing someone employed for at least sixteen hours a week. The universal benefit was created by the simple mechanism of reducing the Tax Credit and Child Tax Credit withdrawal rates to zero.
This article describes further research on the same scheme using EUROMOD: software which employs Family Resources Survey (previously Family Expenditure Survey) data to calculate individuals’ gains and losses for members of a full range of households.
The task in 2010
In 2010 we wanted to test whether it is possible to revise the tax and benefits system in such a way as
1) to increase employment incentives and make nobody worse off for household gross earnings up to £750 per week for families with children and up to £450 per week for single adults without children;
2) to reduce administrative complexity considerably by turning Working Tax Credits and Child Tax Credits into nonwithdrawable benefits;
3) and to do it by making as few other changes as possible to the current system.
The method:
We took three family types:
a) Single adult, no children, local authority tenant (working 40 hours per week)
b) Lone parent, two children under 11, local authority tenant (working 16 hours per week)
c) Couple, with two children under 11, private tenant (working 40 hours per week)
We used the spreadsheet employed by the Department for Work and Pensions to construct their Tax Benefit Model tables to calculate net incomes after housing costs for gross earnings between £20 and £1,200 per week for a variety of schemes for each of the household types a) to c) and have compared those net incomes with net incomes under the current system.
The scheme
The scheme which provided the closest fit with the criteria 1) to 3) above was as follows:
We replaced Working Tax Credits and Child Tax Credits with unconditional and nonwithdrawable benefits of £60 pw for each adult and £31.59 pw for each child (effectively an increase in Child Benefit of £31.59 p.w.).
Income tax was collected on all earned income as follows:
- From £0 to £20,000 pa, 20%
- From £20,001 to £40,000 pa, 35%
- Above £40,000 pa, 40%
We removed the Lower Earnings Limit for National Insurance Contributions, and also the Upper Earnings Limit. This meant that National Insurance Contributions as well as Income Tax was charged on all earned income, not just on that above the Lower Earnings Limit.
We reduced the Housing Benefit taper from 65% to 40%
The graphs below show the results:
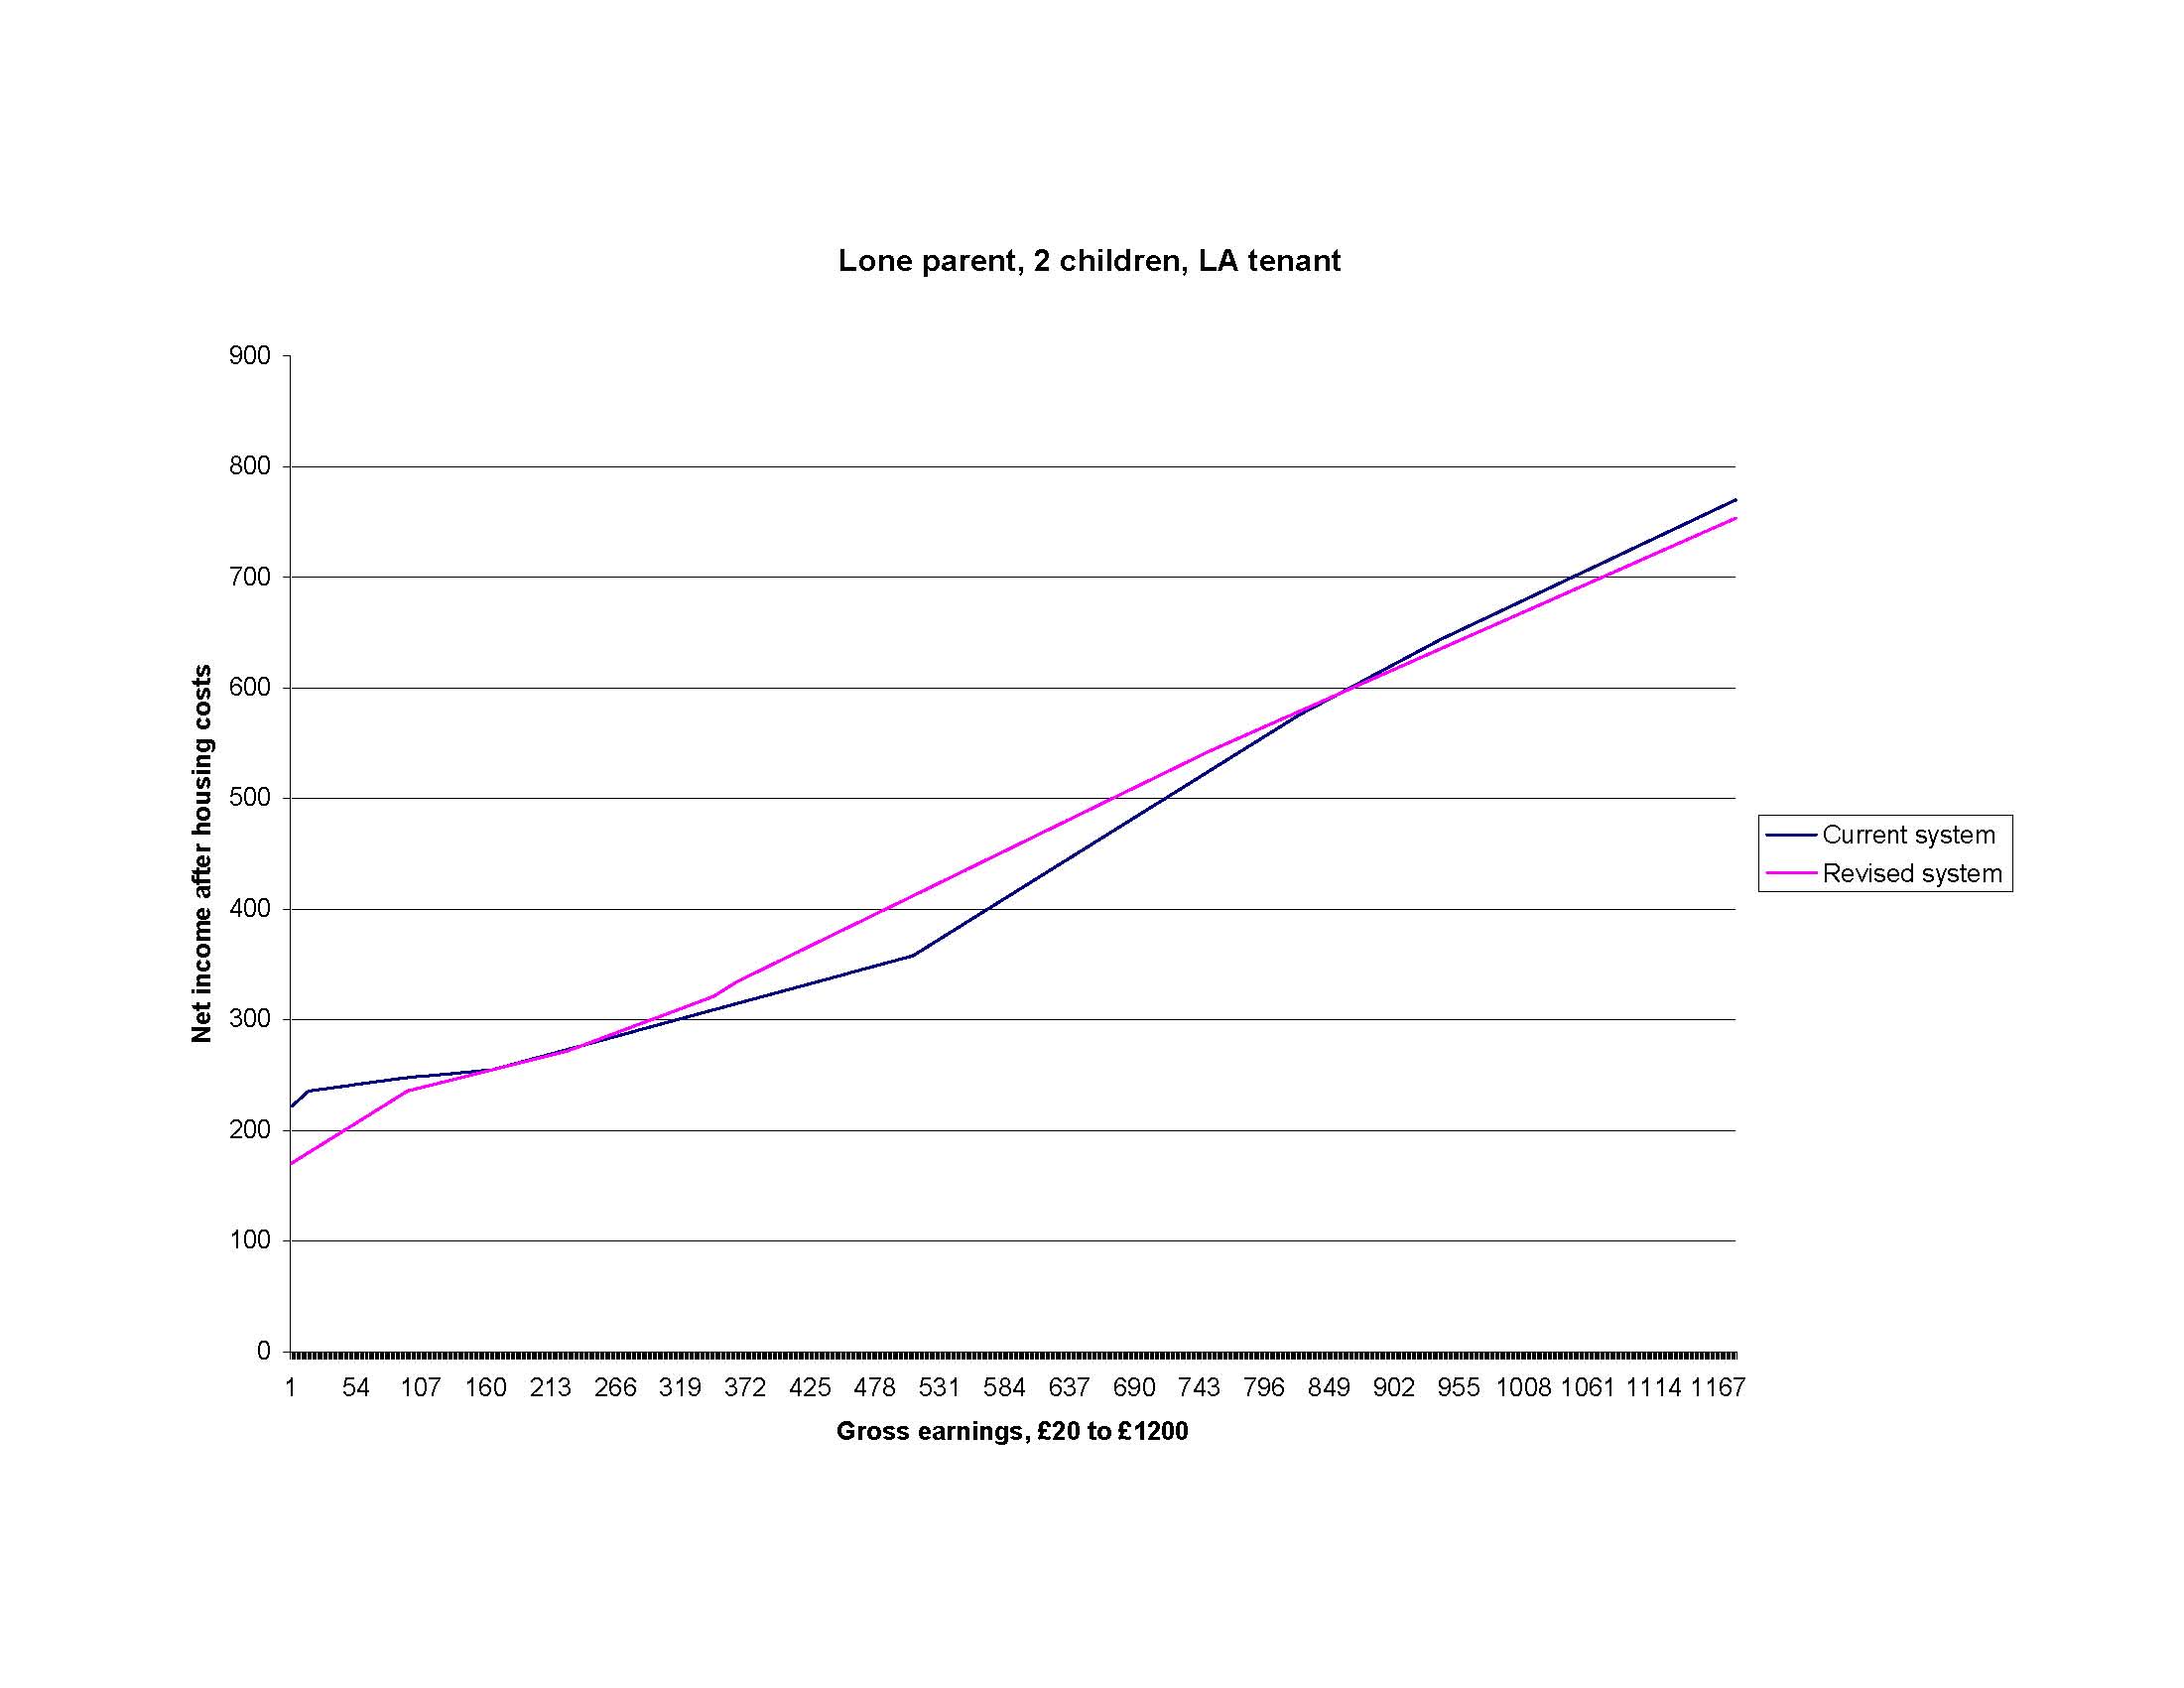
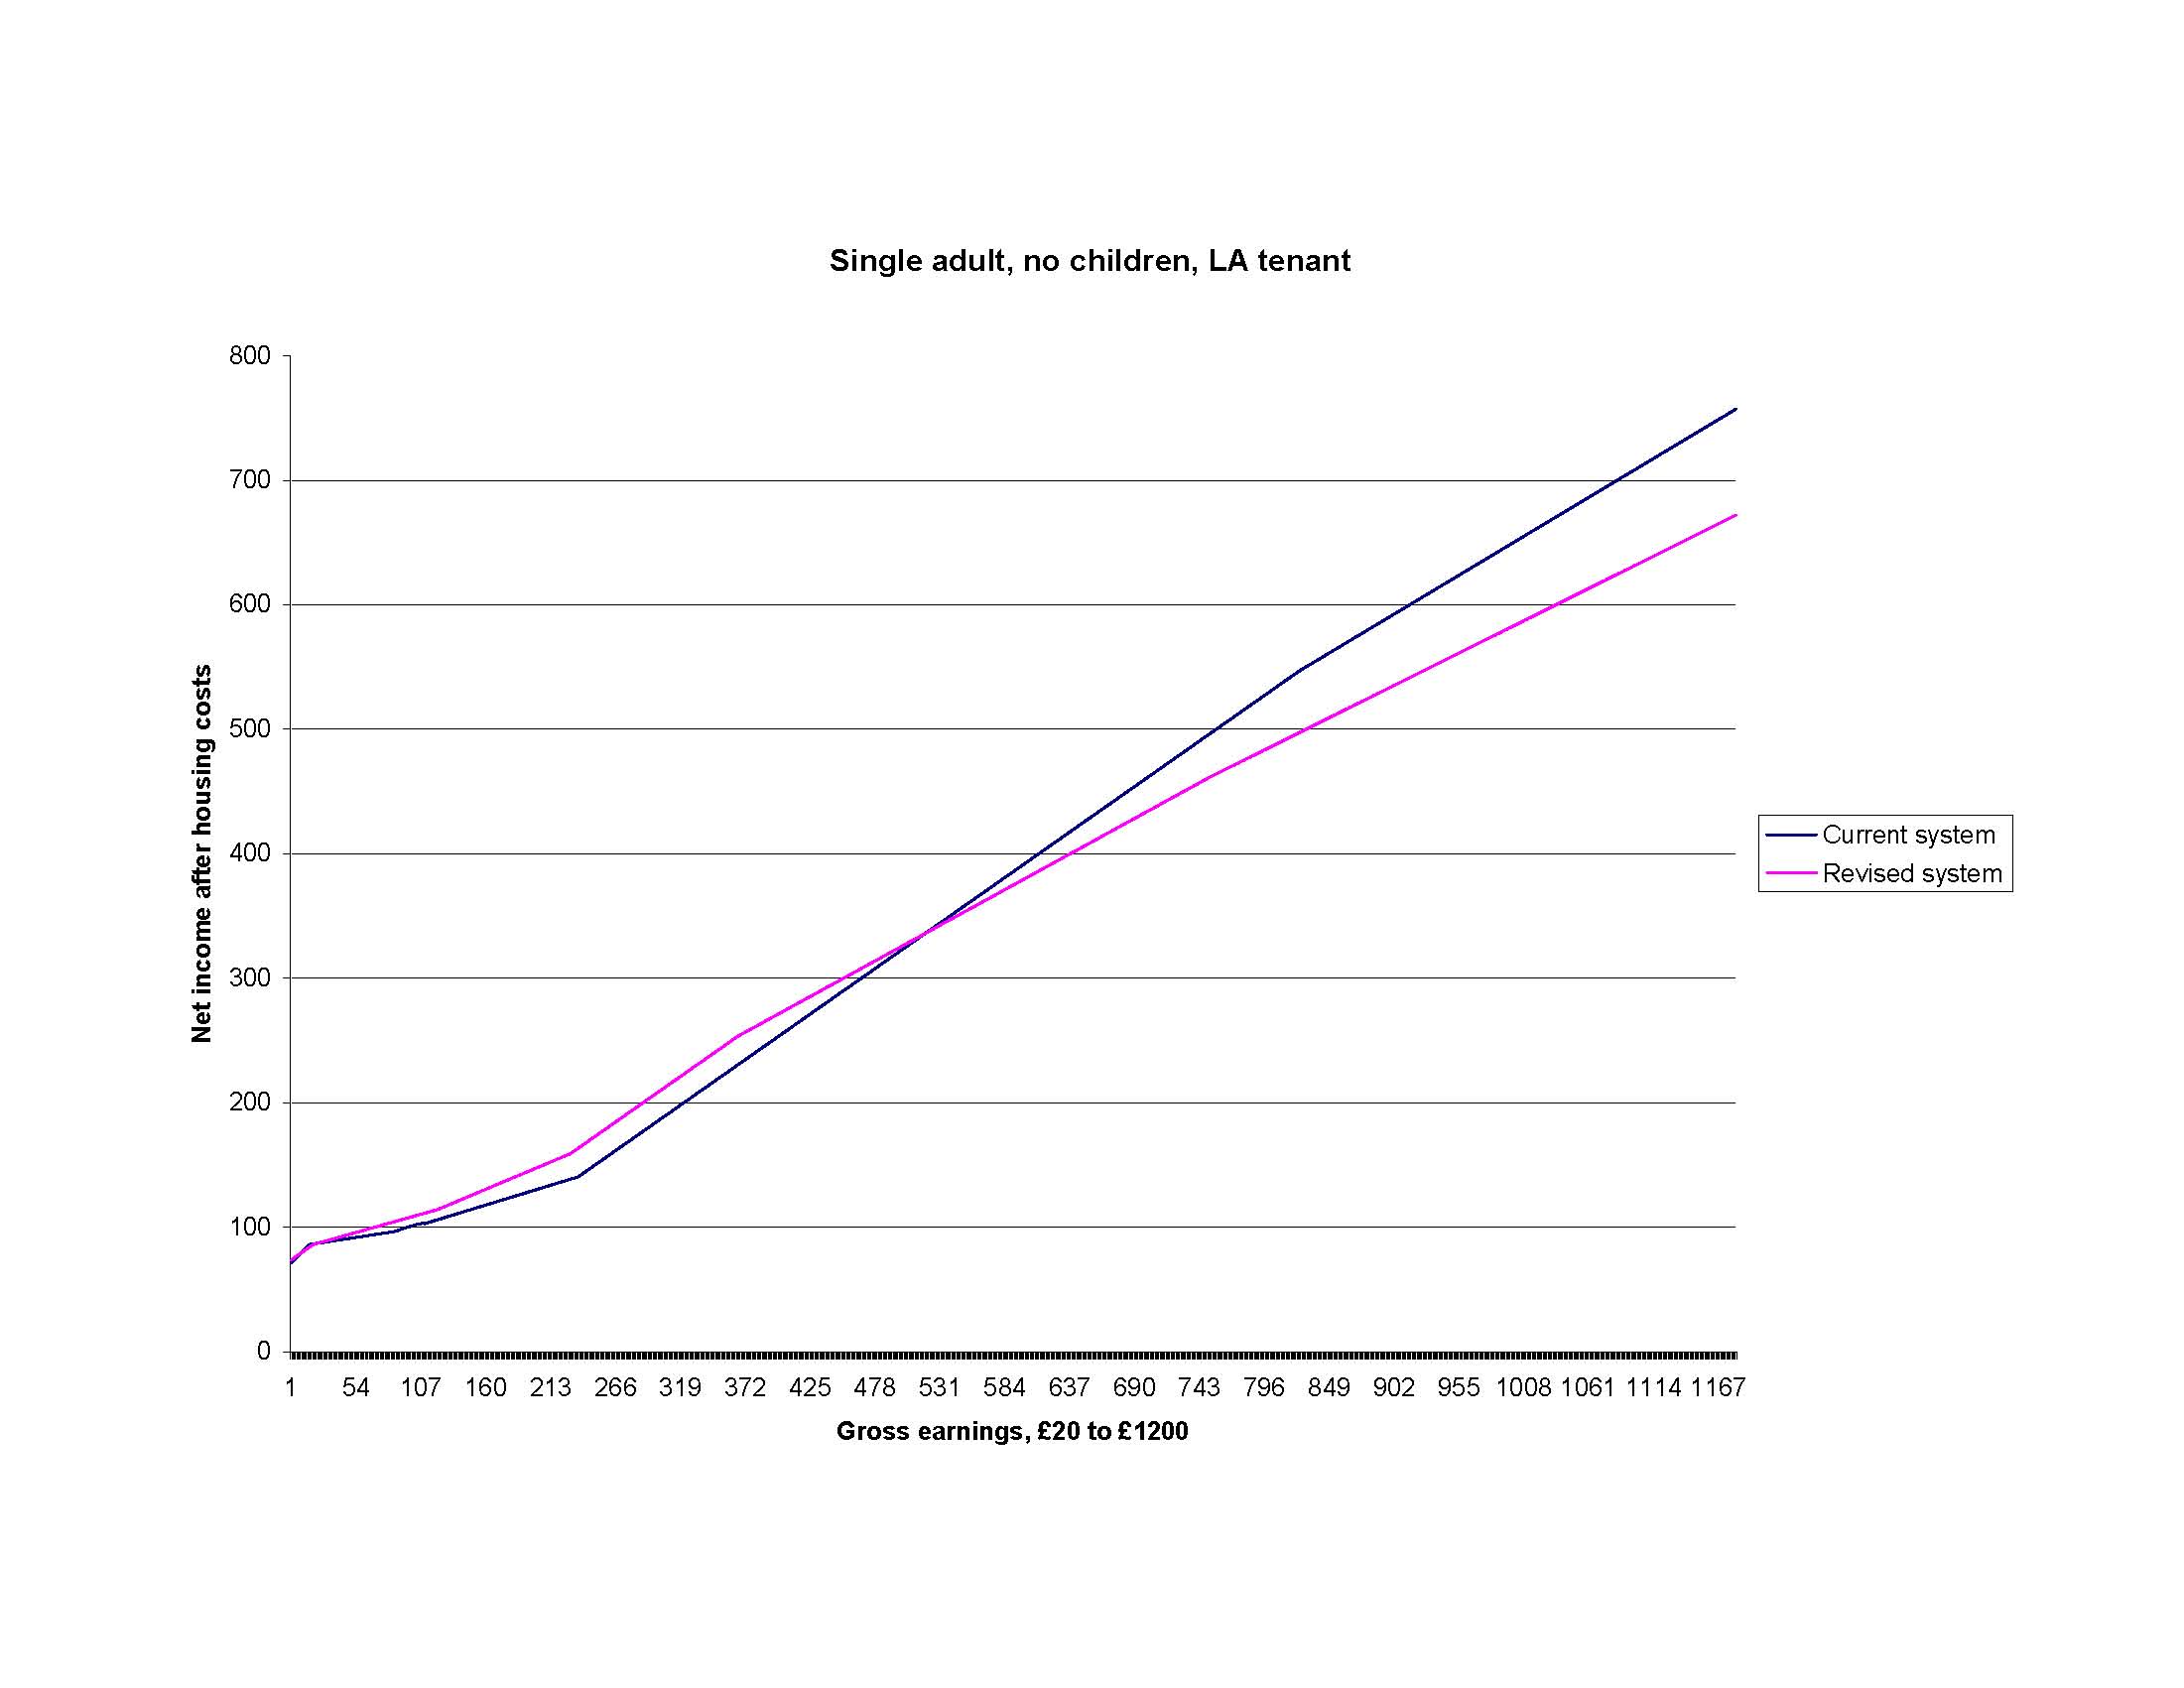
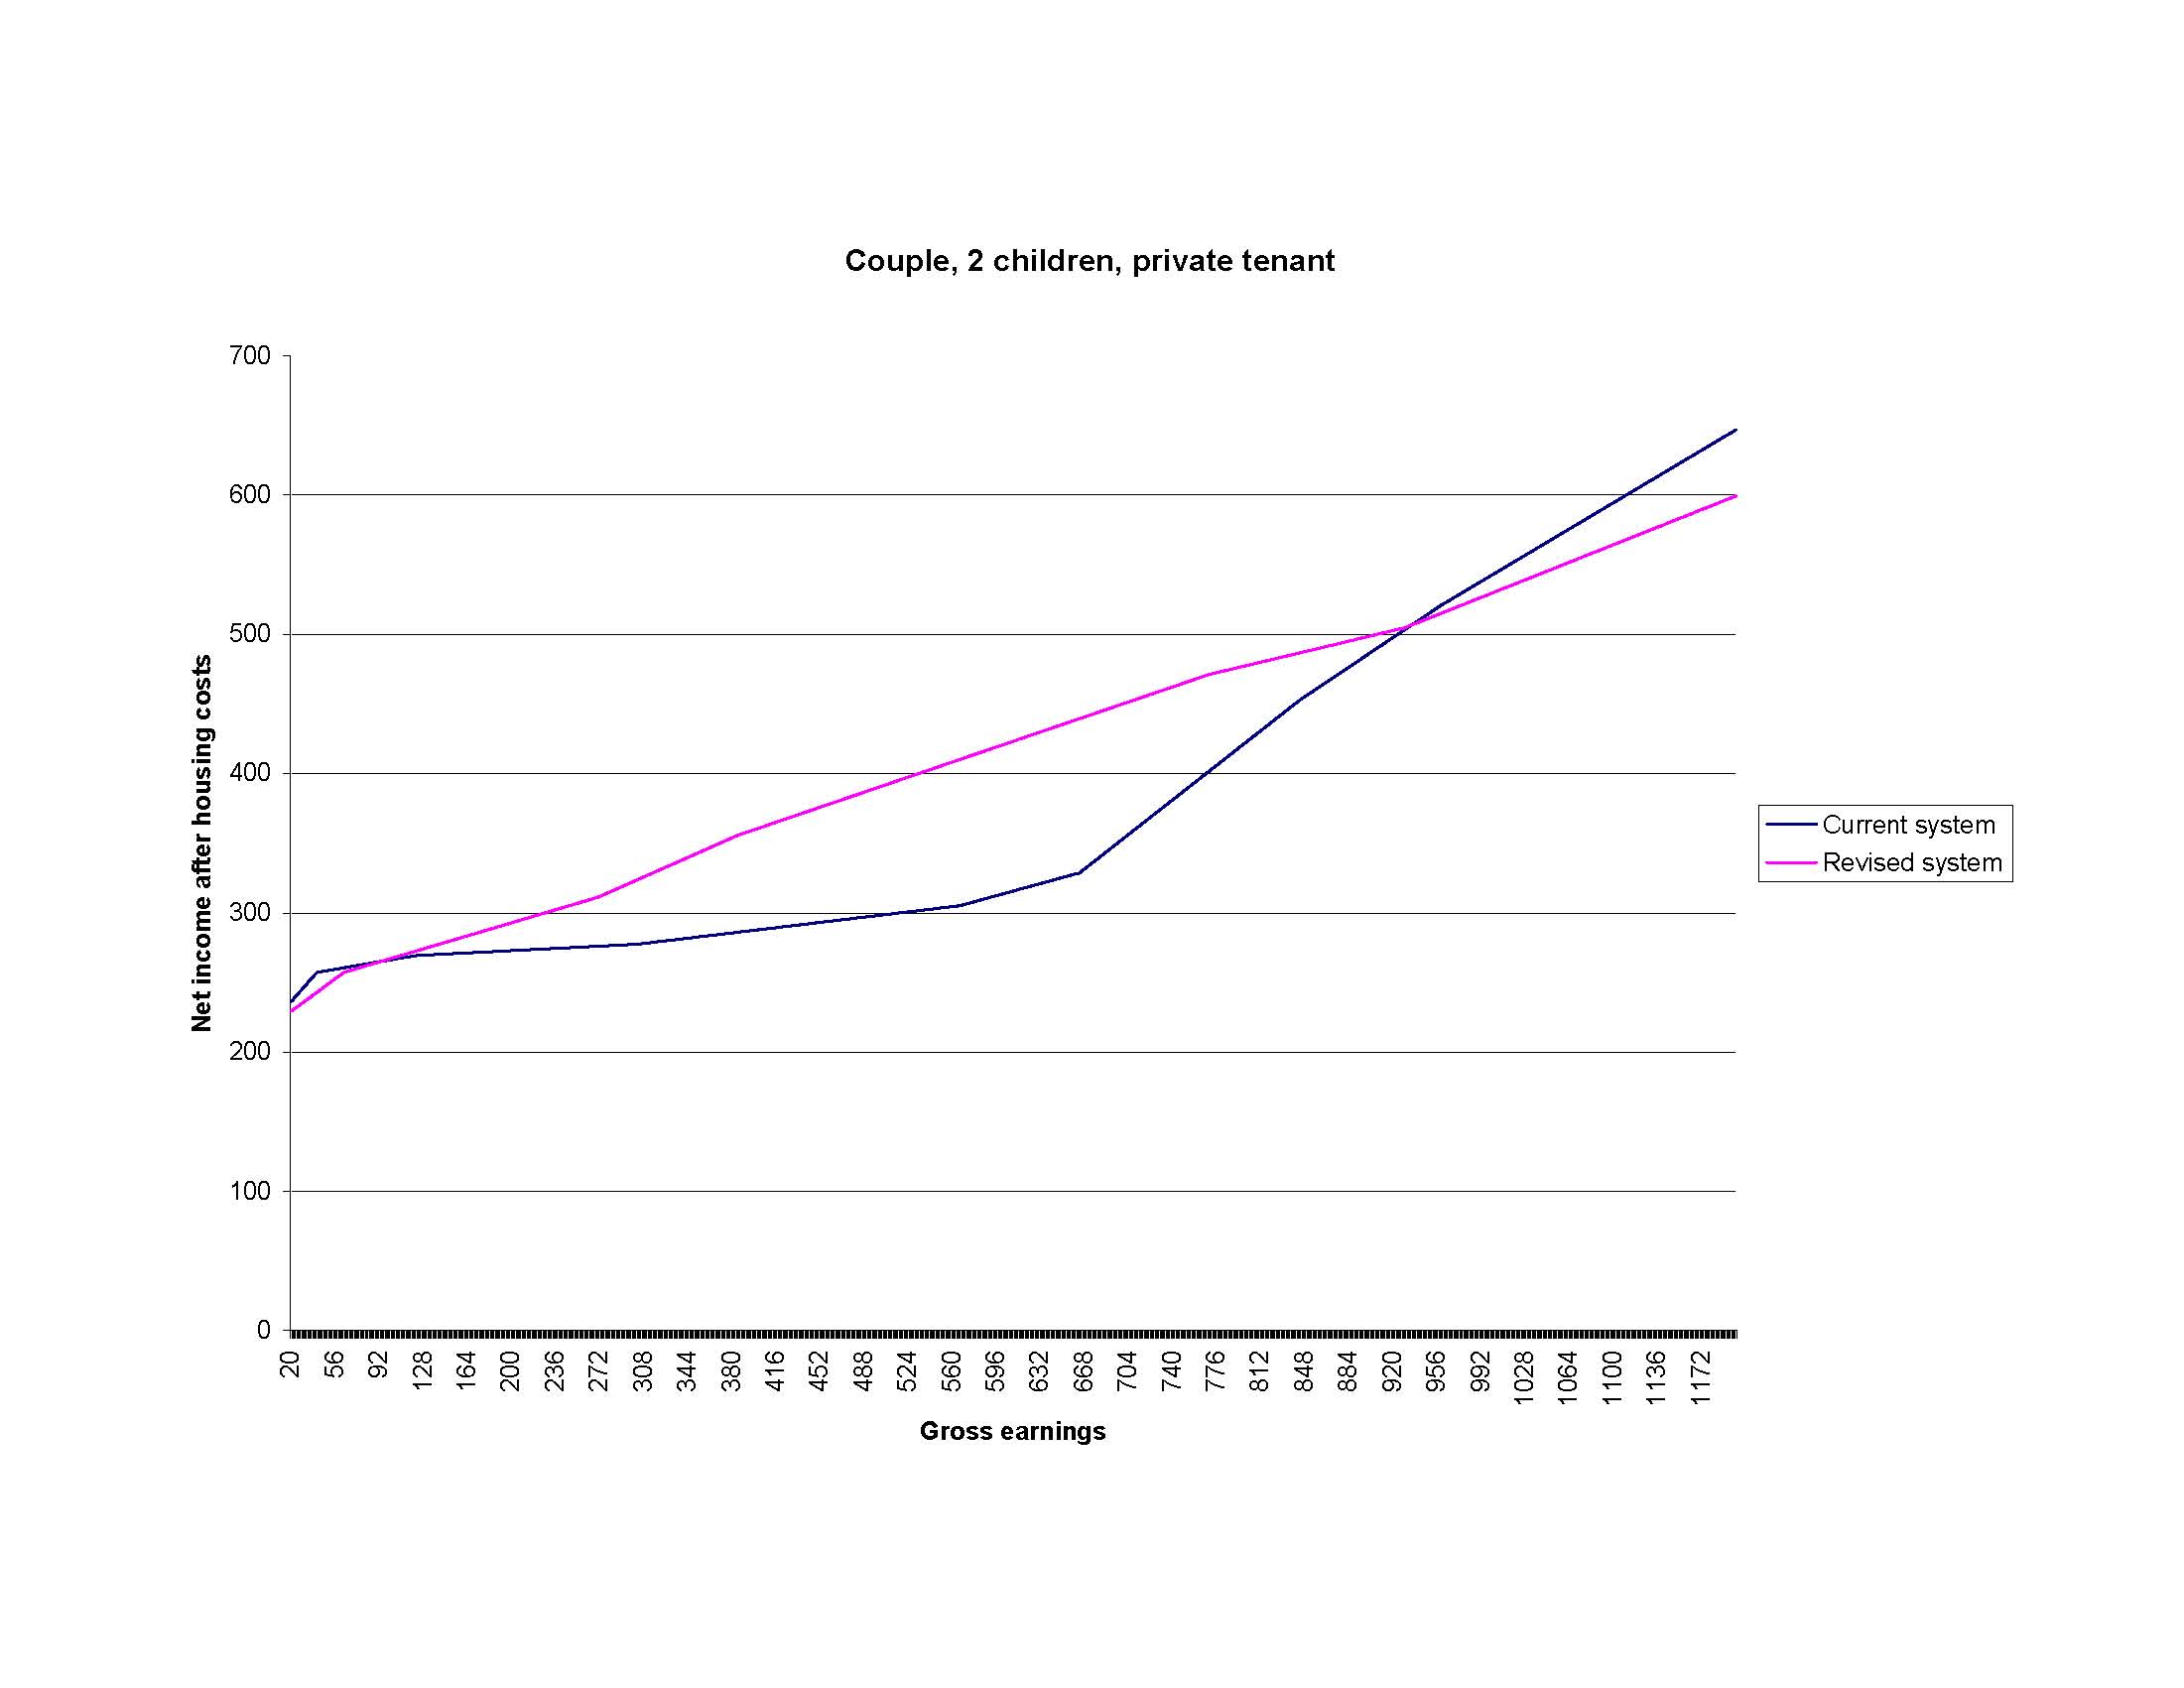
The steeper curve resulting from the revised scheme indicated higher employment incentives, particularly for the couple with children.
EUROMOD
EUROMOD is a tax-benefit model for the European Union, developed by the Institute for Social and Economic Research at the University of Essex. The UK part of the model, which is similar to the previously-used model POLIMOD, employs Family Resources Survey data to calculate the actual difference in disposable income experienced by individuals when a change is made to the tax and benefits system.
The data is constructed from a survey of 57,276 individuals in the UK, i.e., approximately 0.1% of the population. The most recent data available is from 2008, and the most recent tax and benefit levels and regulations employed by EUROMOD are for 2009 – which is fortunate, because those are the levels and regulations we employed when we used the Department for Work and Pensions spreadsheet to evaluate our 2010 scheme.
EUROMOD’s output is of two kinds: Disposable incomes for every one of the 57,276 individuals (which can be compared with disposable incomes under the current scheme), and mean disposable incomes for earned income deciles. (In this case disposable income is net income before housing costs. Because all we are evaluating is gains and losses, it isn’t too much of a problem that in 2010 we were calculating net income after housing costs, and that now we are calculating net income before housing costs, because absolute levels will be the same; but we need to be aware that if we were able to factor in housing costs – which we aren’t – then the percentages mentioned below would be different. Each of our two projects stands up on its own, so in research terms it is no problem that what we have called disposable income in the second project is not the same as net income in the first project.)
Findings
EUROMOD simulation shows that the scheme we constructed in 2010 would result in large gains or losses for thousands of individuals. This was not picked up by the 2010 project because for that project we only tested the scheme on three particular household types, whereas the Family Resources Survey covers every conceivable household type and employment pattern.
Adjustments to the scheme
So we have now tested numerous adjustments to the scheme in order to achieve fewer and lower losses. Clearly it was going to cost additional revenue to reduce those in the lower earnings deciles experiencing major losses, and we were going to have to abandon our previous aim of revenue neutrality: so we set a limit of £3bn of additional expenditure per annum.
The scheme which fitted these criteria is as follows:
Working Tax Credits and Child Tax Credits are still replaced with unconditional and nonwithdrawable benefits of £60 pw for each adult and £31.59 pw for each child (effectively an increase in Child Benefit of £31.59 p.w.). (The couple element is also set at £60 per week, which ensures that in a couple each of the two individuals receives an unconditional benefit. In this project we were also able to decide to leave all other Tax Credit levels, for instance, for disability, as they are, and to make them nonwithdrawable too.)
Income tax is collected on all earned income above a Personal Tax Allowance of £4,000 pa (rather than on all earned income) as follows:
- From £4,001 to £20,000 pa, 25% (rather than at 20%)
- From £20,001 to £40,000 pa, 35%
- Above £40,000 pa, 45% (rather than 40%)
We retain the Lower Earnings Limit for National Insurance Contributions (rather than removing it), and we remove the Upper Earnings Limit, as before.
We reduce the Housing Benefit taper from 65% to 40%.
The results
The mean of disposable incomes for the new scheme is never more than 3% below the mean of disposable incomes for the current scheme for any income decile. Mean disposable incomes in the first three deciles are very close to previous levels. In the fourth decile the mean is 3% above the previous level, and in the fifth 4%, and in the sixth 7%. This pattern is a direct result of the non-withdrawal of Tax Credits, and represents the kind of employment incentive we’re looking for amongst mid-range earners. (This result tells us nothing about individual households because on a change in disposable incomes many households will be sorted into different deciles, but it does give some guide as to how much redistribution is going on).
[table id=27 /]
Some gains and losses will be in the same household, and a more detailed study would be required to discover the aggregate losses suffered by individual households.
The difference between the sum of monthly gains and the sum of monthly losses is a positive £173,603, which means that for these 57,276 individuals an additional £2m of Government expenditure will be required each year. This means that the additional cost of the adjusted scheme will be approximately £2bnper annum.
Discussion
By making some simple changes to our current tax and benefits scheme we have achieved an unconditional and nonwithdrawable benefit for every individual in a household currently containing someone receiving Tax Credits. The steeper gains in disposable income as earned incomes rise will mean lower employment disincentives; and turning Tax Credits into nonwithdrawable benefits will save considerable sums in administration, which should pay for much of the additional £2bn of expenditure per annum.
It will be a political decision as to whether anything should be done to ameliorate the losses of those very high earners who will lose over 15% on the implementation of the scheme.
A question remains over the 8.7% of the population who will experience losses of between 10% and 15%. These are almost all in the earnings mid-range, and most will currently be receiving withdrawable Tax Credits and suffering substantial marginal deduction rates. Under the revised scheme they will experience lower marginal deduction rates. The fact that marginal deduction rates will be lower than before will mean that additional earnings will translate more easily into additional disposable incomes. Many of these households will currently be suffering from the problem that it is not worth the partner of someone in full-time employment seeking part-time employment because they will achieve almost no additional disposable income for the household. Under the revised scheme no such penalty will apply, and all additional earned income will translate into additional disposable income for the household. Now that we have applied a £4,000 Personal Tax Allowance in addition to the £60 per week benefit, part-time earnings will be particularly significant for household budgets. It should therefore be relatively easy for the relevant households to repair the loss relating to the revised scheme, and then to go on adding to their earned income and therefore to their disposable income.
At the moment, those in employment for too few hours for receipt of Tax Credits, or who are receiving Income Support or Jobseekers’ Allowance and earning small sums, might be amongst those suffering losses under our revised scheme because they won’t be receiving Tax Credits and so won’t receive their nonwithdrawable replacement, but they will be experiencing a lower personal allowance and increased initial Income Tax rate. This problem will disappear when Universal Credit is implemented from 2013 onwards, because then out-of-work and in-work benefits will be combined and we shall be able to run a similar project to calculate the simple changes required to establish an unconditional and nonwithdrawable benefit for every UK citizen.
Acknowledgements: We are most grateful to the Department for Work and Pensions for use of their Tax Benefit Model Tables spreadsheet in 2010, to the Institute for Social and Economic Research at the University of Essex for the use of EUROMOD, to Professor Holly Sutherland for advice and tuition in the use of EUROMOD, to the European Commission for funding the development of EUROMOD, and to the UK Data Archive for the use of Family Resources Survey data